"Are we secure enough to ship?" shouldn't take a spreadsheet
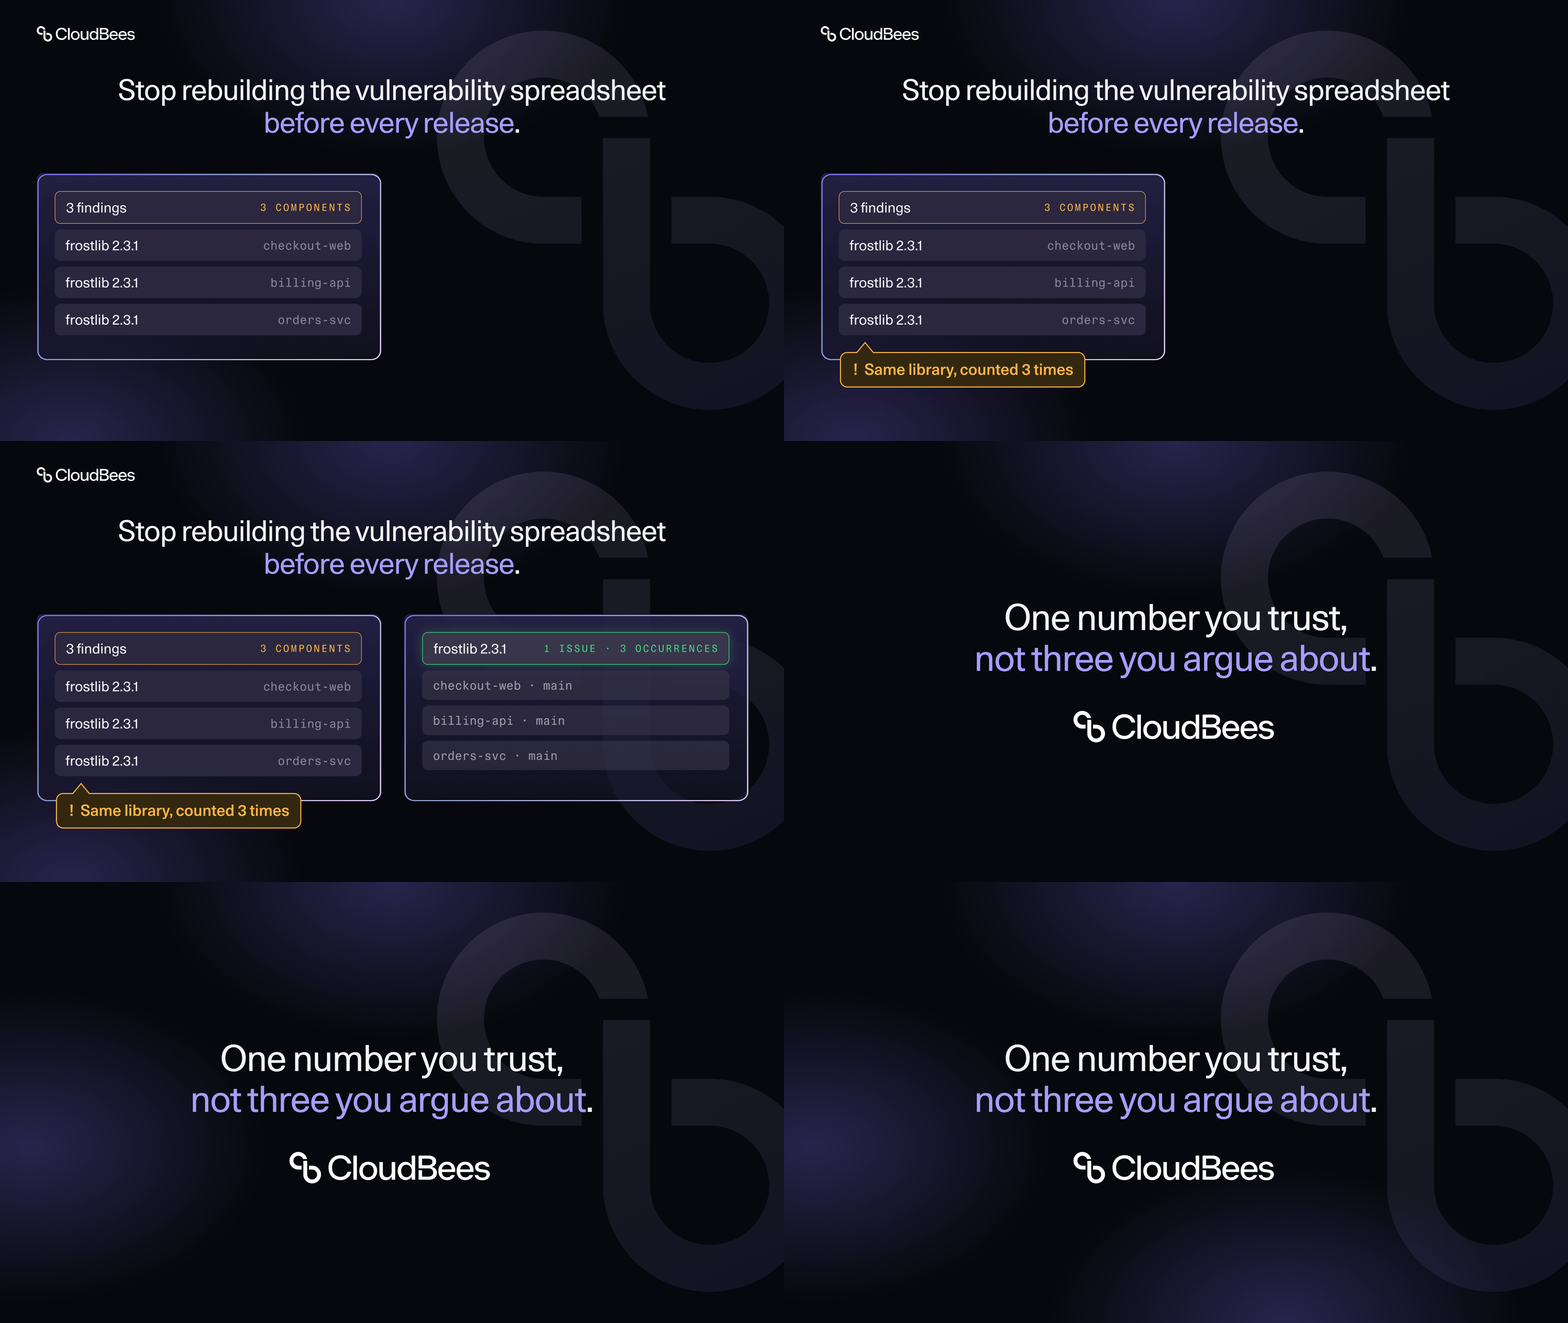
Ask three people in your org how many open vulnerabilities you have and you'll likely get three numbers. Scanners report their own counts. Pipelines show their own view. Application-level screens show another. Some of these double-count the same underlying problem.
The people asking are security leads, platform owners, and engineering managers, and the questions are simple:
- Are we secure enough to release right now?
- Which applications and components are driving most of our risk?
- Where should we focus first?
Many teams answer by building their own executive dashboards outside CloudBees Unify, then spending hours reconciling numbers between tools. If you can't trust the view, it isn't a system of record.
What's new
The Security Dashboard is the first stop for org-wide posture in CloudBees Unify.
- A Dashboard tab, first in the Security menu. One click from anywhere in Security. It follows your existing security permissions, so there's nothing new to configure.
- Org and child-org scope. The dashboard includes applications, components, and branches from your org and its child orgs.
- A posture summary at the top. Total open issues and occurrences, a severity breakdown (Critical, High, Medium, Low), and the resolved count. Each card compares the current value to last week, so you can see direction as well as position.
- Issues, not noise. The security issues table lists open issues linked to your applications and to unlinked components across your org scope. Search by issue code or issue name, and toggle on resolved items when you want the full history.
- Occurrences, in context. Expand an issue to see the individual occurrences behind it: name, tool, status, SLA due date, and first identified. SLA dates follow your org's SLA configuration. For code findings, a link opens the code in the connected system and highlights the relevant line, where supported.
- Filters that move everything together. Filter by severity, tool, status, and first-identified date. Filters update the grid and charts consistently, combine freely, and clear in one step.
- One-click quick filters. Select a Critical, High, Medium, Low, or Resolved summary card to filter the issues grid instantly. No filter setup required.
How issues and occurrences are counted
The dashboard separates two things most tools blur together.
An issue is a distinct problem, such as a specific vulnerability. An occurrence is one instance of that issue in a particular place. One vulnerable library used across 40 components is one issue with 40 occurrences. Issues are deduplicated, so a single problem doesn't inflate your totals, and you can still drill into every place it appears.
This distinction holds across the header, the tables, and the filters, so the numbers agree with each other.
Who it's for
- Security and AppSec teams get a trusted org-wide view to monitor posture and spot SLA risk.
- Engineering managers can focus on the applications and components their teams own.
- Platform and SRE leaders see which tools and areas drive findings, without leaving CloudBees Unify.
- Org owners get a posture check at a glance.
Get started
- In CloudBees Unify, open Security > Dashboard.
- Review the summary cards for your org, including child orgs.
- Click Critical or High to jump to what needs attention first.
- Expand an issue to see its occurrences, SLA due dates, and first-identified dates.
- Combine scope and findings filters to narrow to your team's applications.